The Data Dilemma: Why More Information Isn't Always Better
Golden Hook & Introduction
SECTION
Nova: What if the very data you meticulously collect, the insights you painstakingly derive, are silently sabotaging your strategic decisions? Not because the data is wrong, but because your own brilliant mind is playing tricks on you.
Atlas: Whoa. Hold on. Are you saying my own brain is actually the biggest threat to my perfectly structured data analysis? That sounds… terrifyingly plausible.
Nova: Absolutely! And it’s a dilemma that lies at the heart of our discussion today. We often assume more information automatically leads to better decisions, but the truth is far more nuanced. Our internal wiring can create blind spots, distorting how we perceive and act on facts.
Atlas: I've definitely felt that subtle pull, like a gut feeling fighting the spreadsheet. So, how do we even begin to untangle that?
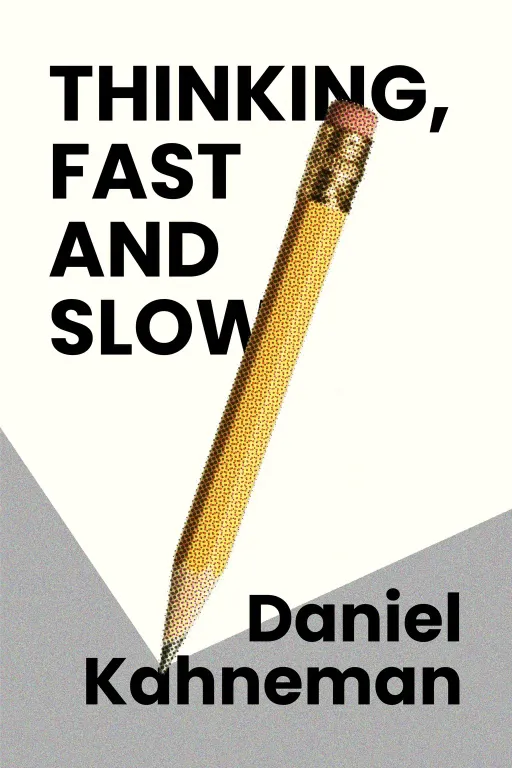
Nova: Well, we’re going to dive into two foundational texts that illuminate this exact challenge: Daniel Kahneman’s groundbreaking work, “Thinking, Fast and Slow,” and “Nudge” by Richard H. Thaler and Cass R. Sunstein. These books collectively explore how our minds work and how we can design better systems around our inherent human irrationality.
Atlas: Kahneman, a psychologist, winning a Nobel Prize for economics… that alone tells you this isn't just about spreadsheets and algorithms. It’s about understanding the human element that breathes life—or sometimes, confusion—into data.
Nova: Precisely. Kahneman, a psychologist, actually won the Nobel Prize in Economic Sciences for his work on prospect theory, which forms the bedrock of “Thinking, Fast and Slow.” It fundamentally changed how we understand economic decision-making, showing that psychology is inseparable from strategic outcomes.
The Invisible Architects of Our Minds: Cognitive Biases
SECTION
Nova: And that brings us to our first core idea: the invisible architects of our minds – cognitive biases. Kahneman expertly details what he calls System 1 and System 2 thinking. System 1 is our fast, intuitive, emotional brain, the one that makes snap judgments. System 2 is our slow, deliberate, logical brain, the one that crunches numbers.
Atlas: So you're saying my 'gut feeling' that tells me to trust a certain data point, even if the numbers are a bit shaky, is System 1 at play? And my late-night spreadsheet deep dives are System 2?
Nova: Exactly! And System 1, for all its efficiency, is a hotbed of cognitive biases. It’s designed for quick survival, not necessarily for objective data analysis. For a strategic architect, this can be incredibly dangerous. Think about confirmation bias, for instance.
Atlas: Okay, confirmation bias. I know the term, but how does it specifically sabotage a strategic data analysis? Like, I'm looking at conversion rates, not trying to prove my political views.
Nova: That’s a great question, and it’s far more subtle than you might think. Imagine you're a strategic architect, and you've championed a new project, let's call it 'Project Phoenix.' You've invested significant time and resources, and now you're reviewing its initial performance data. System 1, driven by your personal investment and desire for success, will subconsciously gravitate towards metrics that validate Project Phoenix's efficacy. You might overemphasize positive early indicators, or downplay negative trends, perhaps attributing them to 'initial teething problems' that will 'surely resolve themselves.'
Atlas: So, I'm looking for evidence that confirms my initial belief that Project Phoenix is a winner, rather than objectively evaluating all the data? I can see how that would lead to blind spots, especially if you're presenting to a board that also wants to see positive results.
Nova: Precisely. System 1 creates a narrative where Project Phoenix is already a success, and System 2, instead of critically challenging that narrative, often becomes its 'press secretary,' rationalizing away any contradictory data. You might focus on a small segment of high-performing users while ignoring the larger, less engaged cohort, or interpret correlations as causations simply because they align with your desired outcome. This isn't malicious; it's just how our minds work to maintain cognitive consistency and reduce discomfort.
Atlas: That makes me wonder about the 'deep question' from our reading: where in our current data analysis might an unnoticed bias be at play? If I'm leading a project, I'm inherently biased towards its success. So, how do we, as strategic architects, even begin to fight that default setting? It sounds like we're always walking into a data minefield, designed by our own brains.
Nova: It can feel that way, but understanding it is the first step. Think about 'anchoring bias' too. If the first piece of data you see is a projected revenue of $10 million, all subsequent analysis might be unconsciously anchored to that number, making deviations seem either too low or too high, skewing your strategic adjustments. The more data you collect, if you're not aware of these biases, the more ammunition your System 1 has to confirm its pre-existing beliefs.
Designing for Better Decisions: Nudges and Systemic Solutions
SECTION
Atlas: Okay, so we're biased. And collecting more data without awareness might just amplify those biases. That sounds a bit out there, but I get it. So, what now? If our brains are these invisible architects building flawed data interpretations, how do we actually something about it? How do we build better decision-making systems?
Nova: That's where our second book, "Nudge" by Thaler and Sunstein, comes into play. They show us that we can't just wish away biases. Instead, we can design environments and choices in a way that 'nudges' us and others toward better, more rational decisions, even when System 1 is running the show.
Atlas: "Nudges." So, small changes in presentation. Give me an example that a strategic architect could actually use with their data. I'm thinking about presenting complex findings to a stakeholder who might be prone to their own biases.
Nova: Absolutely. Think about default options. Thaler and Sunstein famously illustrated this with organ donation rates. In countries where you have to to be an organ donor, rates are low. But in countries where you are a donor by default and have to, rates are incredibly high. The decision itself is the same, but the default option 'nudges' people towards a certain choice.
Atlas: So, it’s about making the desired outcome the easiest path. How does that translate to data presentation for strategic architects?
Nova: Consider your data dashboards. Instead of presenting raw numbers and expecting stakeholders to draw the 'correct' conclusion, you can design the default view or the initial presentation to highlight the most critical, unbiased insights. For example, if you want to emphasize long-term sustainability over short-term gains, you could make the default graph show a 5-year trend, rather than a 3-month snapshot. Or, you could default to displaying a "risk-adjusted" profit metric, subtly nudging the decision-maker away from purely top-line revenue that might look appealing but hides underlying issues.
Atlas: I like that. It's like you're not forcing a decision, but you’re structuring the information environment to reduce the cognitive load of making the 'right' decision. It's about designing transparency and clarity, almost making the unbiased interpretation the 'default.'
Nova: Exactly! Another powerful nudge for strategic architects is framing. How you frame data points can dramatically alter perception. Instead of saying, "10% of customers churned," which evokes loss aversion and might trigger System 1 panic, you could say, "90% of customers retained." Same data, different frame, and a much more positive psychological effect, encouraging a more thoughtful System 2 response rather than an emotional reaction.
Atlas: That's powerful. It’s not about manipulating, but about presenting information in a way that invites a more rational, less biased assessment. So, we're moving beyond just identifying our internal biases to actively engineering our decision-making environments to counteract them. That sounds like true impact.
Synthesis & Takeaways
SECTION
Nova: This is where the magic happens for the strategic architect. The ultimate mastery of data isn't just about collecting more or building more complex models. It's about understanding the human operating system that interprets that data. It's about becoming an architect of decision-making, not just of data infrastructure.
Atlas: That's actually really inspiring. So, it's not just about what the data, but how we're wired to it. And then, how we can subtly rewire the presentation to ensure we're hearing the most accurate story.
Nova: Absolutely. The profound insight here is that true data leverage comes from a deep appreciation of human psychology. It’s about recognizing that our minds, while brilliant, are also prone to predictable errors. By understanding these errors and designing systems and presentations that account for them, we can transition from simply collecting data to truly transforming it into impactful strategic action.
Atlas: So, for our listeners, the strategic architects and insightful analysts focused on driving impact, what's one concrete step they can take this week to apply these ideas?
Nova: Here’s your challenge: Identify one critical data report or dashboard you rely on weekly. Then, consciously examine it through the lens of System 1 biases. Ask yourself: "How might my brain, or the brain of my stakeholder, be unconsciously distorting this information? What small 'nudge' could I implement in its presentation or discussion to encourage a more objective, System 2-driven interpretation?" It could be as simple as changing a default filter, re-framing a key metric, or even just adding a single, clarifying sentence.
Atlas: That’s a practical, actionable step. It’s about becoming a 'choice architect' for our own data. This is Aibrary. Congratulations on your growth!