The Art of the Weaponized Lie
12 minGolden Hook & Introduction
SECTION
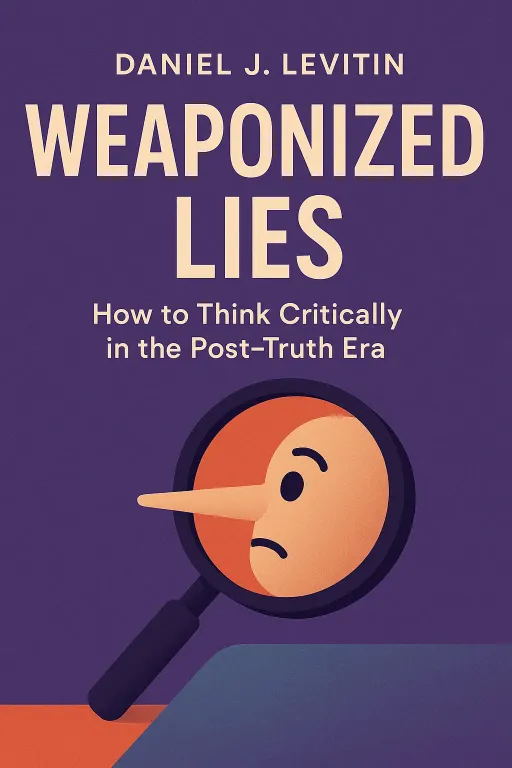
Sophia: Laura, I saw this claim from a home security company the other day. It said, "Ninety percent of home robberies are solved with video provided by the homeowner." It totally makes you want to run out and buy a camera system, right? Laura: It absolutely does. That statistic hits you right in the gut. It feels so powerful, so convincing. And it’s also a perfect example of a weaponized lie. It’s not technically false, but it's designed to mislead you completely. Sophia: Wait, how is that possible? How can it be both true and a lie? Laura: That is the million-dollar question, and it’s exactly what we’re diving into today with the book Weaponized Lies: How to Think Critically in the Post-Truth Era by Daniel J. Levitin. Sophia: I love that title. It feels very of the moment. Laura: It is. And Levitin is the perfect guide for this. He's not just a writer; he's a top-tier neuroscientist and cognitive psychologist. He’s an expert on how our brains process—and get fooled by—information. The book was originally published under the title A Field Guide to Lies, which is just brilliant, and it won several major awards for its clarity and importance. Sophia: A neuroscientist's guide to spotting lies. Okay, I'm in. So what’s the secret behind that home security statistic? Laura: The trick is in the framing. The claim isn't that 90% of all robberies are solved. The reality is that only about 13% of robberies are ever solved. The claim is that of that tiny 13%, 90% of them were solved with the help of video evidence. It’s a classic case of using a sliver of truth to paint a completely misleading picture. Sophia: Wow. That changes everything. It’s like saying 90% of lottery winners bought a ticket. It’s true, but it doesn't tell you anything about your actual chances of winning. Laura: Exactly. And that’s our first stop today: the world of numbers, and how to build a defense against them.
Deconstructing Numbers: The Art of Statistical Skepticism
SECTION
Laura: Levitin argues that our first line of defense against bad statistics is something incredibly simple: a plausibility check. Just asking, "Does this number even make sense?" Sophia: That seems almost too basic. Do people really fall for things that are that obviously wrong? Laura: All the time, because we're not trained to question numbers. He gives this fantastic example. Imagine you hear a claim that the number of marijuana smokers in California has doubled every year for the last 35 years. Sophia: Okay, that sounds dramatic, but maybe plausible? It's become more mainstream. Laura: Let's do the math, as Levitin suggests. Let’s be conservative and say 35 years ago there was only one marijuana smoker in all of California. If that number doubles every year, how many smokers would there be today? Sophia: I'm not a math genius, but... a lot? Laura: After 35 doublings, you'd have over 34 billion marijuana smokers. Sophia: Thirty-four... billion? In California? That’s more than four times the entire population of Earth! Laura: Exactly! It’s utterly impossible. A five-second plausibility check, a quick back-of-the-envelope calculation, shows the claim is absurd. But because we hear a number and a trend, our brain just nods along. Sophia: That's a great point. We're conditioned to see numbers as facts. But you mentioned another way they lie, with averages. I remember mean, median, and mode from school, but I never understood why it mattered. Laura: Oh, it matters immensely. The word "average" is one of the most abused words in statistics. Levitin gives this perfect example. Imagine two small towns, each with a hundred people. In Town A, ninety-nine people earn $80,000 a year, and one person is a billionaire who earns $5 million a year. Sophia: Okay, so mostly a comfortable, middle-class town with one super-rich person. Laura: Right. Now, in Town B, fifty people earn $100,000 a year, and the other fifty earn $140,000 a year. So, a wealthier town overall, but with less extreme inequality. Now, which town has the higher "average" income? Sophia: I'd have to guess Town B, where everyone is earning six figures. Laura: You'd think so. But the mean income in Town A, skewed by that one billionaire, is $129,200. The mean income in Town B is only $120,000. A politician could stand up and say, "The average income is higher in Town A!" and be factually correct. Sophia: But that’s completely misleading! If you picked a person at random, they'd almost certainly be richer in Town B. Laura: Precisely. The outlier—the billionaire—drags the mean, or the mathematical average, way up. The median, which is the middle value, would tell a much truer story. This is how statistics are weaponized. Someone picks the type of average that tells the story they want you to hear. Sophia: It’s like they’re choosing their own facts. Laura: Levitin quotes the famous line: "Everyone is entitled to their own opinions. But they are not entitled to their own facts." The problem is, they can create the illusion of facts by manipulating numbers. And it gets even worse when they start drawing pictures.
The Treachery of Graphs: How Visuals Lie
SECTION
Sophia: Okay, so they can lie with raw numbers. But what about graphs? A graph feels so objective. It's just a picture of the data. Laura: That's the trap! As Levitin, the neuroscientist, explains, our brains are visual pattern-matching machines. We evolved to spot a predator in the grass, not to read a spreadsheet. Graphs hijack that ancient, powerful system. And the easiest way to do it is with what he calls "axis shenanigans." Sophia: Axis shenanigans? I love that. What does it mean? Laura: It means messing with the X and Y axes of a graph to create a false impression. The most famous example he uses is a graph that was shown on Fox News about the Bush tax cuts expiring. It was showing what would happen if the top tax rate went from 35% to 39.6%. Sophia: So, a 4.6 percentage point increase. Laura: Correct. A relatively small change. But the graph they showed was breathtakingly deceptive. Instead of starting the vertical Y-axis at zero, they started it at 34%. Sophia: Wait, you can just do that? Just chop off the bottom of the graph? Laura: You can, and they did. The effect was that the bar for the 35% rate was tiny, and the bar for the 39.6% rate looked six times taller. It created the visual impression of a 600% tax hike. Sophia: That is just... dishonest. The actual increase is about 13%, but the picture they painted was of a financial apocalypse. Laura: It's a perfect weaponized lie. No numbers were technically wrong, but the visual story was a complete fabrication. Our eyes see the massive bar and our brain screams "huge increase!" before our logical mind can even check the numbers on the axis. Sophia: Are there other tricks like that? Laura: Oh, plenty. You can use deceptive illustrations. He points to an infographic about inflation where a 4.2% inflation rate was shown as a giant pair of scissors cutting 42% off a dollar bill. The image implies a tenfold greater impact. Or you can plot cumulative data. If a company's sales are declining each month, the total cumulative sales will still always go up, just more slowly. Graphing the cumulative number hides the decline and makes it look like everything is still growing. Sophia: That's so insidious. You're not just fighting the numbers anymore; you're fighting your own brain's interpretation of the picture. Laura: Exactly. And that brings us to the final, and maybe most difficult, part of the toolkit: evaluating the human element behind the information.
The Human Element: Evaluating Expertise and Hidden Stories
SECTION
Laura: So we've learned to question numbers and visuals. But Levitin says the ultimate skill is evaluating the source itself. Who is telling this story, and are they a credible expert? Sophia: This feels like the hardest part. How do you even begin to tell a real expert from a fake one? Laura: Levitin points out that expertise is domain-specific. A Nobel Prize-winning physicist isn't automatically an expert on nutrition. We have to look for credentials, experience, and peer recognition within the relevant field. But even then, he tells this incredibly powerful and tragic story about why even the most brilliant people can be fooled. Sophia: I'm listening. Laura: It’s the story of Steve Jobs. When he was diagnosed with pancreatic cancer, it was a rare, slow-growing, and highly treatable form. His doctors told him surgery would almost certainly cure him. Sophia: Okay, so that sounds like a clear path forward, based on expert medical advice. Laura: It was. But Jobs was a counter-culture thinker. He was skeptical of mainstream institutions. He went online and found a world of "alternative" cures—special diets, fruit juices, acupuncture. He was a genius, a billionaire, but he was also a human who was scared. He chose to believe the compelling stories from these pseudo-experts over the data from his doctors. Sophia: Oh no. What happened? Laura: He delayed the surgery for nine months while he pursued these alternative treatments. In those nine months, the treatable cancer spread. By the time he went back to conventional medicine, it was too late. He had been persuaded by people who were not experts, and it cost him his life. Sophia: Wow. That's heartbreaking. If Steve Jobs can fall for that, what chance do the rest of us have when we're facing a difficult decision? Laura: That's the core question. Levitin’s answer is that we have to build a hierarchy of sources in our minds. Is this claim coming from a peer-reviewed scientific journal? That's top-tier. Is it from a major, reputable newspaper with a history of fact-checking? Pretty good. Is it from a random blog, a YouTube video, or an anonymous forum? We need to be extremely skeptical. Sophia: Some readers have said the book can feel a bit like a basic textbook at times. But hearing a story like that, it makes you realize these "basic" skills aren't basic at all. They're survival tools. Laura: They are. And the final tool in the kit is perhaps the most important: always look for alternative explanations. The 9/11 conspiracy theories, for example, thrive because they present a compelling narrative. But they ignore the much more plausible, evidence-backed explanation from thousands of structural engineers. We have to actively fight our brain's desire for a simple, dramatic story and ask, "What else could explain this?"
Synthesis & Takeaways
SECTION
Laura: So, when you put it all together, Levitin is giving us a three-part critical thinking framework. First, evaluate the numbers: are they plausible, what kind of average is being used? Second, evaluate the words and pictures: are the graphs misleading, is the language designed to provoke emotion over reason? And third, evaluate the source: is this a real expert, and what are the alternative explanations? Sophia: It feels like a lot of work. In a world of constant information, how can anyone keep up? Laura: Levitin has a beautiful answer for that. He says the internet has saved us an enormous amount of time. We don't have to go to the library to look things up anymore. His argument is that we should reinvest a tiny fraction of that saved time into verification. Sophia: I like that. So, what's the one thing you think listeners should do differently after hearing this? Laura: I think it's this: before you believe, and especially before you share, a shocking claim or a dramatic graph, take thirty seconds. Just thirty seconds. Do a quick search for the source. Do a quick plausibility check in your head. Ask yourself, "Is there another way to look at this?" That small investment of time is the price of admission for living in the modern information age. It's our defense against the weaponized lies. Sophia: That feels manageable. It’s not about becoming a full-time cynic, but a part-time, healthy skeptic. It makes me want to go back and look at my own beliefs and ask, "Wait, where did I actually learn that from?" Laura: And that is the beginning of thinking critically. Sophia: A perfect place to end. Laura: This is Aibrary, signing off.
