Unseen Structures: How Data Reveals the Path to True Accommodation.
Golden Hook & Introduction
SECTION
Nova: Think about data for a moment. What often comes to mind? Spreadsheets, graphs, cold, hard numbers, right? But what if I told you that data, in its purest form, is actually one of the most powerful emotional tools we have for sparking change and driving justice?
Atlas: Whoa, Nova, that's a bold claim! "Emotional data"? For many of us, especially those navigating intricate regulations or trying to champion dignity in complex systems, data feels more like a technical hurdle, a necessary evil, not a heartstring-puller. How do you make a spreadsheet cry out for justice?
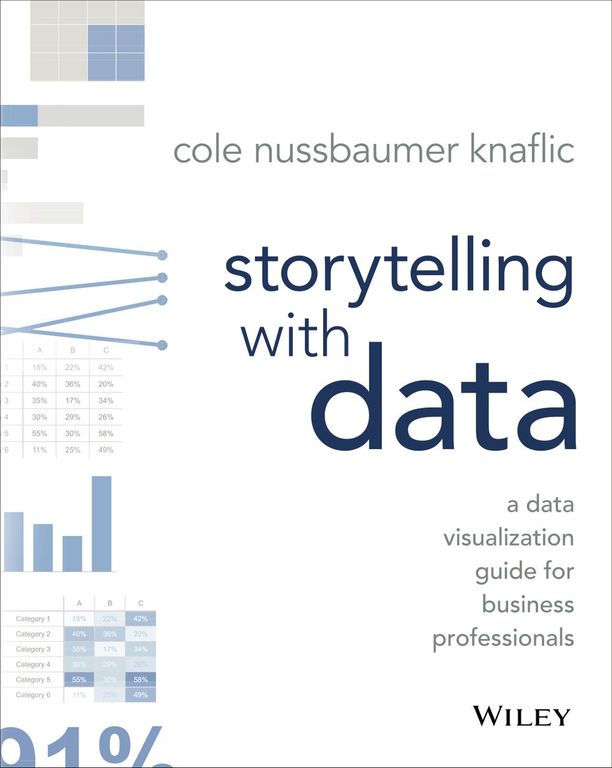
Nova: Exactly! That's the magic. Without clear, compelling data, the need for accommodation, for fairness, for systemic improvement often remains unseen, unheard. It's just a whisper in a crowded room. But transform those raw numbers into a story, and suddenly, it's a roar. Today, we're diving into how to do just that, drawing wisdom from two absolute titans in the field: Cole Nussbaumer Knaflic, author of the incredibly insightful book, "Storytelling with Data," and the legendary Edward R. Tufte, with his seminal work, "The Visual Display of Quantitative Information."
Atlas: I like that. Turning whispers into roars. Many of our listeners are conscientious advocates and ethical architects, constantly striving for fairness. They're dealing with real human impact, and making those impacts visible is the biggest challenge. So, how do we start making data not just seen, but felt, Nova?
The Art of Data Storytelling for Advocacy
SECTION
Nova: Well, Knaflic's work is a masterclass in this. She shows us how to move beyond basic charts and graphs to create visualizations that don't just present information, but truly compel action. Her core philosophy is that data visualization isn't about pretty pictures; it's about focusing your audience's attention. Think of yourself as a director in a play, and your data is the star. You wouldn't just throw your star on stage in bad lighting, right? You'd use a spotlight.
Atlas: That's a great analogy. For someone who's constantly trying to cut through the noise in a board meeting or an advocacy presentation, this idea of a "spotlight" is really appealing. But how do you actually do that? How do you make data "irresistible" for busy decision-makers who might just skim a report?
Nova: It's all about intentionality. Knaflic teaches us to identify the "what, why, and how" of our data story. Let's take a hypothetical accommodation case. Imagine we have data showing a significant disparity in access for individuals with mobility challenges in public buildings. Raw numbers might show 60% of buildings lack proper ramps. That's a fact. But a Knaflic-inspired visualization wouldn't just show a bar chart of 60%. It would draw your eye to the. Maybe it's a simple line graph showing the declining participation of a specific demographic in community events over time, directly correlating with inaccessible venues. The "what" is the declining participation, the "why" is the lack of access, and the "how" is the solution you propose. She focuses on eliminating clutter, using pre-attentive attributes—like color or size—strategically to highlight the most important message.
Atlas: I can see how that shifts it from a dry statistic to a human consequence. But wait, Nova, isn't there a fine line between compelling storytelling and accidental manipulation? As ethical architects, we're driven by fairness. We need to ensure our data arguments are honest, not just persuasive.
Nova: Absolutely, and Knaflic is very clear on this. Her work is about storytelling, not fabrication. It's about presenting the existing data in a way that its message is undeniable, rather than obscuring it with complexity or irrelevant details. It's about clarity, not trickery. You're not changing the data; you're just making sure its inherent truth shines through. It's about using design to serve the data's integrity, not undermine it.
Ethical Clarity in Data Visualization
SECTION
Atlas: That makes sense. We're not trying to mislead, we're trying to illuminate. But that brings up another crucial point. Even with good intentions, data can be misinterpreted if it's not presented with absolute clarity. What if our compelling story is accidentally misleading?
Nova: That's where the legendary Edward Tufte steps in. He's a master of data aesthetics and clarity, and he's almost a purist when it comes to honest data display. Tufte argues for maximizing what he calls the "data-ink ratio" and ruthlessly avoiding "chartjunk." He’s basically saying, every speck of ink on your page should be serving a purpose to communicate data, not just to look pretty.
Atlas: "Chartjunk"! I love that. So, what exactly is chartjunk? And how does avoiding it ensure precision, especially in sensitive areas like accommodation where misinterpretation could have real consequences for people's lives?
Nova: Chartjunk is anything that doesn't convey information. Ornamental backgrounds, unnecessary shading, elaborate 3D effects that distort proportions, excessive gridlines – basically, anything that clutters the visual and distracts from the actual data. Tufte would argue that these elements increase the "noise" and make it harder for the audience to discern the truth quickly and accurately. For example, if you have a bar chart showing the number of accessible parking spaces, and it's surrounded by busy patterns, thick borders, and a distracting background image, those elements are chartjunk. They don't help you understand the number of spaces; they just make it harder.
Atlas: So, his philosophy is almost a minimalist approach. Maximize data-ink ratio means stripping away anything that doesn't directly contribute to understanding the numbers. For conscientious advocates, this sounds like a moral imperative for transparency. How does one practically apply this to ensure the message is precise and honest without being boring?
Nova: It’s about intentional simplicity. If you have a bar chart showing, say, the percentage of public buildings that are fully accessible versus partially accessible versus not accessible at all. Tufte would say: make those bars clean, clear, and directly labeled. Don't add shadows, don't use a rainbow of colors if two or three will do. Let the data speak for itself through its direct, unadorned presentation. He believed that clarity is not just good design; it's a moral obligation, especially when dealing with data that impacts human lives and policy decisions. It avoids the unintentional biases or misinterpretations that can arise from overly decorative or complex visuals.
Synthesis & Takeaways
SECTION
Nova: So, when you bring Knaflic and Tufte together, you have this incredibly powerful framework. Knaflic gives you the tools to tell a compelling, attention-grabbing story with your data, ensuring it resonates. Tufte provides the ethical compass and the design principles to ensure that story is told with absolute precision and honesty. It’s not just about telling story; it’s about telling the story, powerfully and unambiguously, to drive real change.
Atlas: That's an illuminating connection. It's the difference between just showing numbers and truly advocating for human dignity through those numbers. This isn't just a technical skill; it's a way to amplify the unseen. So, for our listeners who are ready to take a tiny step, what's one practical thing they can do this week?
Nova: Take a recent accommodation case you've been involved with. Map out the key data points – the numbers, the percentages, the trends. Then, try to visualize them using Knaflic's principles, focusing on clarity over complexity. Ask yourself: "What is the single most important message here, and how can I make sure distracts from it?"
Atlas: Excellent. It’s about transforming those cold facts into a compelling narrative that demands action, ensuring every number serves the truth. This is how we, as strategic empathsand ethical architects, make the unseen seen, and the unheard heard.
Nova: Precisely. Let your data be the voice for change.
Atlas: This is Aibrary. Congratulations on your growth!