

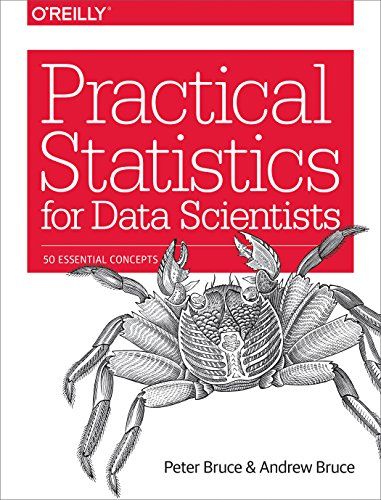
Practical Statistics for Data Scientists: 50 Essential Concepts
The Statistical Secret Sauce
The Statistical Secret Sauce
Nova: Imagine you are standing in front of a massive library filled with every math and statistics textbook ever written. Thousands of pages on probability theory, calculus, and abstract proofs. Now, imagine someone walks up, hands you a slim 300-page guide, and says, forget eighty percent of that. Here are the fifty things you actually need to know to build a self-driving car or predict the stock market. That is exactly what Peter Bruce and his co-authors did with Practical Statistics for Data Scientists.
Nova: Not skip it, but pivot. The central thesis of this book is that traditional statistics was born in an era of data scarcity. Scientists had to squeeze every bit of meaning out of tiny samples, like twenty plants or ten patients. But today, we are drowning in data. The questions we ask have changed from Is this drug slightly better than a placebo? to Which of these ten million users is most likely to click this ad?
Nova: Exactly. And the book is designed to be that tractor manual. It is about bridging the gap between academic theory and the messy, fast-paced world of modern data science. Today, we are going to break down why this book is considered the gold standard for anyone who wants to stop just running models and start actually understanding what the numbers are saying.
Key Insight 1
The Data Science Mindset
Nova: One of the biggest shocks for people coming from a traditional background is how Peter Bruce treats the p-value. In academia, the p-value is the holy grail. If it is under point zero five, you have a discovery. If it is not, you have nothing.
Nova: Right. But Bruce argues that for a data scientist, statistical significance is often less important than practical significance. If you run an A/B test for a website and find a change that is statistically significant but only increases revenue by one cent for every million visitors, was it worth the engineering time to build it?
Nova: Precisely. It shifts the focus from explanation to prediction. In traditional stats, you want to explain why something happened. In data science, you often just care if your model can predict what will happen next, even if the internal logic of the model is a bit of a black box.
Nova: That is where the practical part comes in. Bruce emphasizes that while we prioritize prediction, we still need statistical intuition to spot when a model is hallucinating. He talks a lot about the danger of overfitting, where a model becomes so good at memorizing the past that it is useless for the future. It is like a student who memorizes the practice exam but fails the real test because the questions changed slightly.
Nova: Exactly. It is about using statistics as a guardrail rather than a straightjacket. He covers things like data distribution and sampling bias not as abstract math, but as diagnostic tools to see if your data is actually telling you the truth or just what you want to hear.
Key Insight 2
Exploratory Data Analysis
Nova: Before you ever touch a complex algorithm like a neural network, Bruce insists on something called Exploratory Data Analysis, or EDA. He actually credits John Tukey, a legend in the field, for this approach.
Nova: You would be surprised how many people skip it. They just dump data into a model and hope for the best. Bruce argues that the most important part of any project is finding the story the data is trying to tell before you start modeling. This means looking at estimates of location, like the mean and median, but also understanding the variability.
Nova: And that is exactly the trap. If Bill Gates walks into a room of ten baristas, the average salary might jump to a hundred million dollars, but that average tells you nothing about the people in the room. Bruce shows how the median or even a trimmed mean is often more robust in the real world of messy data.
Nova: It is when you chop off the top and bottom five or ten percent of the data to get rid of outliers like Bill Gates. It gives you a much clearer picture of the typical case. He also pushes for visualization over raw numbers. He says a simple box plot or a histogram can reveal patterns that a spreadsheet of numbers would hide for weeks.
Nova: They show us the range and the spread. Are the data points all bunched up together, or are they scattered across the map? Bruce explains that in data science, the spread is often more interesting than the center. High variability usually means there is an underlying factor you have not accounted for yet. It is a signal to dig deeper.
Key Insight 3
The Resampling Revolution
Nova: Now, we get to one of the coolest parts of the book: bootstrapping. This is where the practical side really shines. In old-school stats, if you wanted to know the error margin of a sample, you had to use these complex formulas based on the normal distribution, the famous bell curve.
Nova: Almost never. Real data is skewed, it has fat tails, it is messy. Bruce introduces bootstrapping as the ultimate modern solution. Instead of relying on a formula, you use the power of your computer to resample your data thousands of times with replacement.
Nova: Think of it like a bag of marbles. You pull one out, note its color, and then put it back in the bag before pulling again. You do this a thousand times. By doing this, you create thousands of simulated samples from your original data. This lets you see how much your results might vary without needing a single complex equation.
Nova: That is a perfect analogy. It is a computational way to measure uncertainty. If your result stays the same across ninety-five percent of those alternate universes, you can be pretty confident in it. Bruce calls this the Swiss Army knife of statistics because it works regardless of the shape of your data. You do not have to worry if it is a bell curve or a zigzag.
Nova: Exactly. And it is not just for averages. You can bootstrap regression coefficients, medians, or even complex machine learning metrics. It is about moving away from theoretical assumptions and toward empirical evidence. It is a very data-centric way of thinking.
Key Insight 4
Prediction vs Explanation
Nova: We have to talk about regression, because it is the bread and butter of the book. Bruce spends a lot of time on it, but he approaches it differently than a math professor would. He focuses on fitted values and residuals.
Nova: Right. If you are predicting house prices, the fitted value is what your model thinks the house should cost based on its square footage and location. The residual is the error, the difference between what the model predicted and what the house actually sold for.
Nova: Exactly. And Bruce teaches us that the residuals are where the real learning happens. If you see a pattern in your errors, it means your model is missing something. For example, if all your residuals are positive for houses near a park, it means being near a park is a variable you forgot to include.
Nova: He does, but he grounds them in statistics. He explains that things like Random Forests are essentially just a lot of decision trees combined through a statistical process called bagging, which is actually just bootstrapping again! It all circles back to those core 50 concepts.
Nova: Spot on. He also warns about the curse of dimensionality. This is a huge problem in data science where you have too many features, like thousands of columns in a spreadsheet. Traditional statistics would say to look for the most significant ones, but Bruce shows how to use techniques like step-wise regression or penalization to prevent the model from getting overwhelmed and seeing patterns that are just random noise.
Conclusion
Nova: As we wrap up our look at Practical Statistics for Data Scientists, the biggest takeaway is that statistics is not a collection of dusty rules, but a living set of tools for navigating uncertainty. Peter Bruce, along with Andrew Bruce and Peter Gedeck, managed to distill the most relevant parts of a massive field into something actionable.
Nova: Exactly. Whether you are doing A/B testing for a startup, building a recommendation engine, or just trying to understand the news, these fifty concepts provide the foundation. It teaches you to be skeptical of averages, to embrace the power of resampling, and to always look at your residuals. In a world driven by algorithms, understanding the statistical engine under the hood is what separates the people who just run code from the people who actually solve problems.
Nova: That is the goal. If you can master these fundamentals, the rest is just details. For anyone looking to level up their data game, this book is a mandatory read. It is clear, concise, and incredibly practical.
Nova: This is Aibrary. Congratulations on your growth!