

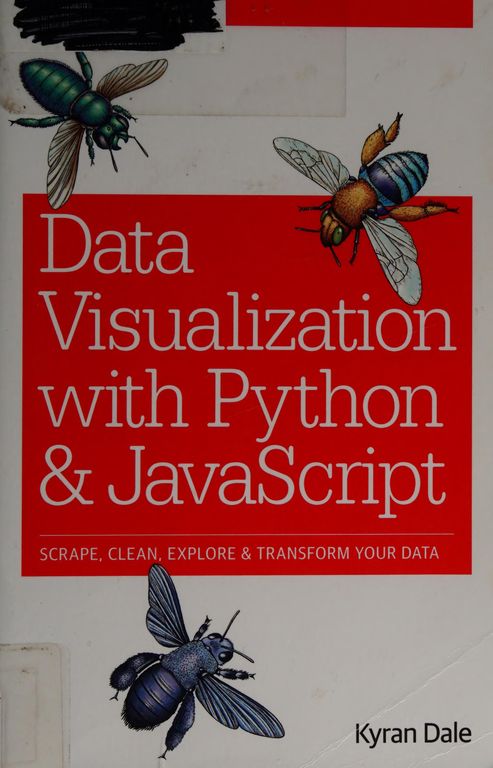
Data visualization with Python and JavaScript
Introduction
Nova: Have you ever looked at a beautiful, interactive chart on a website and thought, I wish I could build that, but all my data is stuck in a messy Excel sheet or a Python script?
Nova: Exactly. And that is where Kyran Dale comes in with his book, Data Visualization with Python and JavaScript. He argues that we do not have to choose between the power of data science and the beauty of the web. We can actually have both.
Nova: It is a commitment, for sure, but Dale’s whole philosophy is about creating a toolchain. He is not just teaching syntax; he is showing you how to build a pipeline that takes raw, messy information from the internet and turns it into a living, breathing story on a screen.
Nova: Exactly. Today we are diving into that system. We are looking at how to scrape, clean, and ultimately visualize data using the best-of-breed tools in both the Python and JavaScript worlds.
Key Insight 1
The Philosophy of the Full Stack
Nova: One of the most interesting things Kyran Dale points out is that Python and JavaScript are actually like two sides of the same coin. Python is the heavy lifter. It is amazing at processing, cleaning, and doing the hard math.
Nova: Precisely. JavaScript is the artist. It lives in the browser. It knows how to talk to the screen and respond to the user’s mouse clicks. Dale’s big insight is that the most powerful data visualizations today happen when these two languages collaborate.
Nova: Dale addresses this head-on. Tools like Tableau are great for standard reports, but if you want something truly custom, something that pushes the boundaries of how we interact with data, you need the flexibility of code. You can build things in D3. js that simply cannot exist in a pre-built software package.
Nova: Yes. And he stresses that in the modern world, web presentation is no longer optional. If you want people to see your work, it has to be on the web. And the web speaks JavaScript.
Nova: That is the beauty of Dale’s approach. He treats it as a bridge. He shows that the logic of data manipulation in Python’s Pandas library actually translates quite well to how you think about data in JavaScript. He is teaching you a workflow, not just two separate silos of knowledge.
Nova: It is. Python is the engine that drives the first half of the project, taking you from a blank page to a structured dataset.
Key Insight 2
The Python Engine: Scrape and Clean
Nova: Kyran Dale doesn't start with the charts. He starts with the mess. He focuses heavily on scraping and cleaning because, as anyone in the field knows, that is where eighty percent of the work happens.
Nova: Maybe they should! Dale advocates for using tools like Scrapy and BeautifulSoup for scraping. He gives examples of pulling data from real-world sources because that is where the most interesting stories are hidden.
Nova: They do, and Dale is very pragmatic about it. He teaches how to build robust scrapers that can handle the unpredictability of the web. But the real star of the Python section is Pandas.
Nova: Exactly. He shows how to take that scraped, raw HTML or JSON and transform it into a clean, indexed DataFrame. The goal is to get the data into a shape where it is ready to be visualized. He talks about handling missing values, normalizing data, and grouping it to find the patterns.
Nova: That is a great way to put it. And once you have that signal, you need a way to send it to the browser. He introduces Flask as the lightweight web framework to serve that data. It acts as the bridge between your Python backend and your JavaScript frontend.
Nova: It is much simpler for these kinds of projects. Dale chooses Flask because it doesn't get in your way. It does one thing well: it takes a request from the user and hands back the data. It is the perfect glue for this specific toolchain.
Nova: Now we move into the world of pixels and interactivity. It is time for JavaScript.
Key Insight 3
The JavaScript Canvas: D3.js
Nova: If Python is the engine, D3. js is the steering wheel and the dashboard. D3 stands for Data-Driven Documents, and it is widely considered the gold standard for web visualization.
Nova: You are right. D3 is low-level. It doesn't give you a bar chart; it gives you the tools to build a bar chart from scratch. Dale acknowledges that the learning curve is steep, but he explains why it is worth it.
Nova: Because D3 binds data directly to the DOM, the Document Object Model. Every piece of data can be connected to a visual element on the screen. If a value changes, the visual element can animate to its new position. This creates a level of immersion and interactivity that simpler libraries just cannot match.
Nova: Usually, yes. Dale breaks down the core concepts of D3, like selections and data binding. He shows how to use SVG, which stands for Scalable Vector Graphics. SVGs are perfect for data because they are mathematically defined shapes that stay crisp no matter how much you zoom in.
Nova: That is exactly what you are doing. And Dale is very focused on the best practices of web design too. He doesn't just want you to make a chart; he wants it to be accessible and responsive so it looks good on a phone or a giant monitor.
Nova: He does. He talks about the trade-offs. Sometimes you do the heavy math in Python before sending it over, and sometimes you let the browser handle the interactive filtering. It is all about finding that balance.
Key Insight 4
Building the Bridge
Nova: Organization is the secret sauce of this book. Dale emphasizes a modular approach. You shouldn't have one giant file that does everything. You have your scraping scripts, your cleaning scripts, and your web server all acting as distinct components.
Nova: Exactly. And the most critical part of this bridge is the data format. Dale pushes for JSON as the universal language. Python can export it easily, and JavaScript consumes it natively. It is the perfect medium for moving information between these two worlds.
Nova: He does touch on integrated frameworks, especially in the newer edition of the book. He looks at Dash, which allows you to build interactive web apps using mostly Python. It is a fantastic tool for rapid prototyping.
Nova: That is the trade-off. Dash is great because it keeps you in the Python ecosystem longer, but D3 gives you that artisanal touch. Dale’s goal is to give you the skills to decide which tool is right for the job. He doesn't want you to be a one-trick pony.
Nova: It really is. He even dives into how to deploy these apps. It is one thing to have it running on your laptop, but Dale shows you how to get it onto a server so the whole world can see it. That is the final step in the toolchain.
Conclusion
Nova: We have covered a lot today, from the heavy-duty data crunching of Python and Pandas to the elegant, interactive world of JavaScript and D3.
Nova: The takeaway for me is that while the technology changes, the need for clear, compelling data stories only grows. Whether you are using a Python backend or a JavaScript frontend, the goal is always the same: to make the invisible visible.
Nova: If you are looking to level up your data game, this toolchain is a powerful one to have in your arsenal. It might take some time to learn both sides of the bridge, but the results speak for themselves.
Nova: That is the spirit. Keep building, keep exploring, and most importantly, keep telling those data stories. This is Aibrary. Congratulations on your growth!