Data Truth: Unmasking Hidden Realities
Podcast by Wired In with Josh and Drew
Ten Easy Rules to Make Sense of Statistics
Data Truth: Unmasking Hidden Realities
Part 1
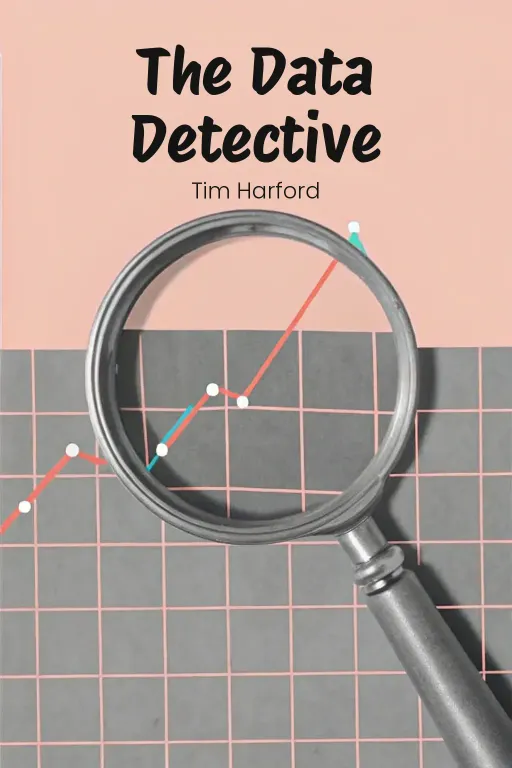
Josh: Hey everyone, welcome back! Today we're jumping into something we're all swimming in, but probably don't think about enough: data. I mean, everywhere you look, there are numbers telling us things – about our health, crime, even what's trending. But... is that data always telling the truth? Drew: Exactly, Josh. We like to think we're logical, but our brains are weird. We tend to believe stats that already line up with what we “want” to believe. It's like our brain is its own little spin doctor, twisting the numbers to fit the narrative it prefers. Josh: Which is a perfect segue, actually, because we're talking about Tim Harford's The Data Detective today. It's a fantastic guide to navigating statistics in a smart way – without just swallowing everything whole or dismissing it out of hand. Harford offers ten simple rules for really understanding data, balancing that healthy skepticism with genuine curiosity. He walks us through common biases, how the media and algorithms play games with us, and how we can cut through the noise to make smarter choices. Drew: So, we're going deep on crime stats, media manipulation, and those sneaky algorithms that think they know us better than we know ourselves. It’s all about understanding how data shapes our reality, and what to watch out for when things just don't quite add up. Josh: Right. We're going to break it down into four key areas: how our own brains mislead us, Harford's essential rules for deciphering stats, the traps set by media and algorithms, and why understanding statistics is more important than ever. Think of it as a mental cheat sheet for navigating the data deluge we're all facing. Drew: So, buckle up because we're not just crunching numbers; we're diving into the ethical stuff, too. Can we really trust algorithms to be unbiased? What happens when our feelings start writing the data's story? Okay, let’s get started!
The Psychology of Data and Bias
Part 2
Josh: You teed that up perfectly, Drew! Now we're plunging into the fascinating, yet thorny, world of data interpretation – the psychology behind it. It's all about how our feelings and biases influence the way we perceive and trust statistics. Tim Harford really nails it, using examples to illustrate how our brains can both be our greatest asset and our biggest liability when it comes to numbers. Drew: Exactly, Josh. The psychology of data is so key. Before we even glance at the graphs and numbers, our brains are already pre-deciding what to believe. And at the heart of that is what Harford calls “motivated reasoning.” Isn't that the perfect term for the mental contortions we perform when reality clashes with our existing beliefs? Josh: Spot on. Motivated reasoning is like wearing a pair of cognitive blinders, guiding us towards what we want to be true, regardless of the facts. For instance, think about the climate change debate. It's pretty clear how political affiliations almost entirely dictate how different groups interpret the same data on carbon emissions or global temperature increases. Drew: Let me guess, depending on which side you're on, the data is either unassailable, rigorous science or—wait for it—cherry-picked propaganda. Same stats, totally polarized interpretations. Josh: Precisely! The actual science isn’t the problem—it's the underlying psychology. Motivated reasoning acts as a kind of shield, safeguarding core beliefs or group identities. So instead of objectively looking at the numbers, people tend to scrutinize any data that contradicts their views while readily accepting anything that confirms their pre-existing stance. Drew: It's like being a referee at your kid's soccer game. You tend to only spot the fouls against your team and conveniently miss all the, ahem, creative plays your side makes. And the crazy thing is, this isn’t some obscure phenomenon. You don't need a PhD for motivated reasoning to kick in; it's just part of being human. Josh: Exactly. And what makes it so insidious is that it’s often unconscious. For instance, Harford points out that our ability to assess evidence rationally can crumble when that evidence threatens a core belief or identity. Whether it's politics, religion, or even just die-hard loyalty to a sports team, our emotions get entangled in how we interpret information. And, you know, speaking of emotions, it's not just our reasoning that gets hijacked—our feelings can completely take over the driver's seat Drew: Oh, let me guess, you're thinking of the Abraham Bredius story? That’s a classic example of how emotions can totally derail even the most seasoned experts. Josh: Definitely! Abraham Bredius was the art expert of his time, especially when it came to Vermeer. But despite all his knowledge, he was completely duped by a forgery—Christ at Emmaus. Here was a man who prided himself on his scholarly rigor, yet when this fake painting landed on his desk, he was immediately smitten. Drew: So, the emotional part of his brain staged a coup and took over completely? Josh: Absolutely. Bredius had a huge emotional stake in wanting to restore his reputation after some previous errors. He desperately wanted that painting to be a long-lost Vermeer masterpiece. That desire clouded his judgment to the point where he gushed over it, proclaiming it the pinnacle of Vermeer’s genius. Drew: And boom, a fake gets validated by the ultimate authority. I'm guessing the truth came out years later, leaving Bredius looking… well, emotionally compromised. Josh: Exactly! Experts who looked at the painting more critically noticed glaring inconsistencies in the technique and style. But it took years to expose the truth because any initial doubts were silenced by Bredius's endorsement. It's a perfect example of how emotions like pride and the desire for legacy can blind even the sharpest professionals. Drew: So, this is a cautionary tale for all the self-proclaimed "numbers people" out there? Even the best of us are vulnerable to our emotions? Josh: Totally. It shows us how important it is to check not only the data but also the baggage we bring to it. Bias doesn't just come from ignorance—it can also undermine expertise when emotions outweigh evidence. And speaking of emotional distortions, let's move onto perhaps the most chilling real-world example of all: public health misinformation. Drew: Ah, HIV denialism. That sends shivers down my spine because it's probably the clearest illustration of motivated reasoning on a societal level. We're not just talking about a few individuals falling for false narratives—we're talking about entire groups rejecting life-saving science. Josh: Precisely. HIV denialism stems from a dangerous mix of distrust in medical institutions, the fear of stigma, and the allure of comforting, but untrue stories. I mean, at one point, almost half of gay and bisexual men in America believed that HIV doesn't cause AIDS. It's not just a number; it's decades of public health progress hanging by a thread. Drew: And let's not forget the devastating consequences. People refusing antiretroviral treatments or declining to get tested are unknowingly endangering not only their own lives but also their communities. And the emotional hooks are really similar to the Bredius story, but on a much bigger stage. People want to believe the comforting narrative – that the threat isn’t real – because the truth feels too overwhelming. Josh: Exactly. Harford even draws parallels to the early days of COVID-19. Remember how some academics speculated that the virus's pervasiveness meant it was less severe than feared? That comforting narrative clashed with hard epidemiological data that showed an imminent public health crisis. Yet, it delayed action, eroded public trust, and ultimately made the situation worse. Drew: It's a perfect storm of motivated reasoning and emotional bias. When the truth feels too hard to swallow, people cling to easier options – even when those options lead to catastrophic results. And that's the heart of the matter, right? These biases aren't just intellectual quirks – they have very real and often devastating consequences. Josh: Absolutely. But Harford doesn't leave us wallowing in despair. He stresses the importance of self-awareness. Recognizing motivated reasoning and emotional distortion is the first crucial step. And he suggests fostering analytical habits – approaching data skeptically, being open to opposing viewpoints, and being willing to challenge what we already believe to be true. Drew: So, basically, it's a call for intellectual humility. Approach data with your guard up, but not your walls up. There’s a difference between skepticism that sharpens you and cynicism that blinds you.
Rules for Interpreting Data
Part 3
Josh: Understanding these biases naturally leads us to explore practical rules for interpreting data more objectively. And that's “really” where Tim Harford’s brilliance shines. His ten rules aren't just a list of dos and don’ts; they offer something deeper—a framework for bridging our psychological pitfalls with practical tips to cut through the fog of statistical claims we encounter every day. Drew: Right, it's like a toolbox for navigating the chaos of data, giving us the skills to intelligently interrogate numbers without falling prey to knee-jerk reactions. And what I love about this part of The Data Detective is how the rules feel so grounded in real-world applications. They're not just theoretical—they've got substance, context, and examples that “really” make them stick. Josh: Exactly. Let’s start with the first rule that Harford introduces: "Search Your Feelings." This one “really” taps into what we’ve been talking about – how emotions can distort our interpretation of statistics. Harford emphasizes the necessity of checking ourselves before diving into data. It’s about pausing to ask, "What feelings is this number triggering in me? Am I reacting emotionally or logically?" Drew: Pause for long enough to figure out what your gut’s up to – sounds simple enough, but I’m guessing it’s easier said than done? Josh: Oh, for sure. Because our emotions often draw the map for us before we even realize it. Harford uses a great example to demonstrate this—how people underestimate their personal risk of negative events, like car accidents. The optimism bias kicks in, and suddenly, everyone thinks, "Sure, bad accidents happen... but not to me!" Drew: Which is funny, considering most people probably text and drive—or otherwise think laws of probability don’t apply to them. Josh: Exactly. And that’s the point. Statistics frequently puncture our emotional narratives. When faced with, say, data showing accidents are more common than we think, people cling to their false sense of security. Harford suggests practices like documenting our reactions in a journal to identify recurring emotional biases, or having conversations with people who challenge our worldview. Both of these are steps toward breaking that emotional stranglehold. Drew: Interesting. So, what you’re saying is, you’ve got to become your own data therapist—confront your feelings, do a little cognitive housecleaning, and make room for a more sober narrative about what the numbers actually mean. Josh: Spot on. And this self-awareness, Harford argues, isn’t about suppressing your feelings; it’s about transforming them into tools to better interrogate the data. Which brings us nicely to Rule Three: "Avoid Premature Enumeration." What do you make of that one, Drew? Drew: Oh, it sounds like my dream rule—slow down, analyze what’s being measured before leaping to conclusions. And let me guess—it’s about making sure the data’s definitions aren’t pulling the wool over your eyes. Josh: Exactly. Harford highlights how crucial it is to ask, "What exactly are we counting?" One of the most striking cases here is the United Kingdom’s neonatal mortality statistics. For years, certain hospitals seemed to perform far better at reducing neonatal deaths than others. The natural conclusion was that these hospitals had better resources or staff, right? Drew: Let me guess – turns out that wasn’t the case? Josh: Not at all. An investigator, Dr. Lucy Smith, discovered the real discrepancy lay in how hospitals defined "live births." London hospitals categorized premature infants born as early as 23 weeks as live births, even if, tragically, they didn’t survive for long. Meanwhile, other hospitals classified similar cases as miscarriages. This wasn’t a difference in outcomes—it was a difference in definitions. Drew: Wow, so the whole thing was a classification illusion? That’s wild. And honestly, kind of unsettling. It makes you wonder just how often we trust raw numbers without ever digging into what they’re built on. Josh: Exactly. And that’s the danger of rushing into conclusions without challenging the data’s foundation: the definitions, methodologies, and potential discrepancies in reporting. When we skip that step, even well-meaning policies—like funding hospitals differently—could be built on sand. Drew: Harford’s advice here feels crucial: always interrogate what’s being measured and how. And if the answer isn’t clear? Don’t trust the conclusion. Got it. What’s his next rule—tell me there’s a story in this somewhere. Josh: Oh, you’ll love Rule Five: "Investigate the Backstory." It’s about looking beyond the surface of statistics to trace their origins. Numbers don’t come out of a vacuum; they’re shaped by the context and biases of whoever compiled them. Harford uses the infamous stork-and-birthrate correlation as a humorous example. Drew: Oh no—don’t tell me someone actually thought storks were delivering babies. Josh: Not quite, but without examining the backstory, the data almost seemed to support it. Regions with more storks tended to have higher birth rates. But dig deeper, and you find out the real explanation: rural areas with more open spaces encouraged both higher stork populations and larger family sizes. The stork-baby connection was a spurious correlation, born of contextless data. Drew: That’s both hilarious and a little terrifying. It’s like, if we don’t investigate where statistics come from, we’re left to infer the wildest conclusions. Imagine applying that to something like public policy! Josh: Exactly. The stakes get much higher when we talk about correlations that seem to prove causal relationships. Harford also mentions the groundbreaking research into smoking and lung cancer by Richard Doll and Austin Bradford Hill. The link between heavy smoking and lung cancer wasn’t immediately accepted because people wanted context: Who collected the data? Was the methodology sound? This meticulous investigation was what eventually made their findings bulletproof. Drew: And without it, you'd probably still have people claiming smoking is no worse than eating a bag of chips. This rule’s a big one – unless you know where your numbers come from, chances are, you’re just seeing the tip of the iceberg. Josh: Which leads us perfectly to Rule Six: "Who Is Missing?" Because sometimes, the most important part of a statistic is not what’s visible, but what's absent. Harford’s example here is Uganda’s labor force data. For years, women’s economic contributions were hidden, purely because the surveys weren’t designed to capture secondary or informal work, which many Ugandan women relied on for income. Drew: So basically, they weren’t invisible in their communities, just in the numbers? Josh: Exactly. Once the surveys were adjusted to include informal activities, over 700,000 women suddenly appeared in the labor force—previously classified simply as "housewives." It’s not just about getting better data; it’s about redefining how a society understands itself and its priorities. Drew: That hits hard—because how many other stats are we taking at face value that exclude entire populations? It’s not just data; it’s representation, dignity, and policy all in one . Josh: Exactly. These rules remind us that interpreting data isn’t about passively consuming numbers—it’s about asking hard questions, digging deeper, and being brave enough to confront what you uncover. And from emotions to definitions to inclusivity, Harford equips us with a toolkit that’s as much about ethics as it is about logic.
The Impact of Media and Algorithms
Part 4
Josh: So, with all these cognitive biases we've talked about, it's easy to see how media and algorithms can “really” muddy the waters when we're trying to understand data, right? We’ve looked at how our minds play tricks on us individually. Now we’re talking about how society and technology amplify those effects. Today, we're diving into how media sensationalism and algorithms can skew data, manipulate our perceptions, and mislead us in ways that can feel subtle, but have massive consequences. Drew: Right, Josh. If our own biases are the villains, then media and algorithms are like their super-powered sidekicks. They take those personal weaknesses and weaponize them on a grand scale. So, let’s start with the media, this idea of “fast” versus “slow” statistics. What’s the deal here? Josh: Okay, so "fast statistics," as Tim Harford calls them, are basically those attention-grabbing numbers that you see plastered all over the news. They're designed to get a knee-jerk reaction – fear, anger, shock – you name it, without “really” giving you the full story. "Slow statistics," on the other hand, they take time to unpack. They give you a more complete, but often more complicated, picture. Drew: Ah, so it's kind of like the difference between a clickbait headline and then that in-depth article no one actually reads? Josh: Precisely, precisely. Harford uses crime rates as a great example. The media often makes it seem like we’re living in some kind of crime-ridden dystopia. But, if you look at the actual data – you know, the slow statistics – you’ll see that violent crime, even murder, has largely been on the decline in most countries since the year 2000. The media tends to focus on these isolated, dramatic events, which warps our perception and makes us think the world is way more dangerous than it actually is. Drew: Yeah, classic. It's like reporting every single isolated plane crash, while ignoring all the thousands of flights that land safely every single day. You're just feeding people fear, and fear sells, right? Josh: Exactly! Or, take Ipsos Mori’s research, they looked into public misconceptions. They found that people guessed that 20% of teenage girls give birth every year. The actual number? Just 2%. Or diabetes – people thought 34% of the population was diabetic, when it's “really” only 8%. These overestimations don't just appear out of thin air. They're fueled by sensationalized media coverage that focuses on the exception, and then presents it as the rule. Drew: That makes sense. People remember those shocking stories, right? Like those "Teenage Pregnancy Epidemic" exposés, but they don't bother diving into the actual data. And it's not just laziness, is it? This is where our own psychological biases come into play. If you've seen, say, three emotional segments on the news about a spike in diabetes, your brain isn’t going to ask, "What's the statistical basis for this?" It's just going to recall those media moments and assume, bingo, epidemic! Josh: Exactly! And, that aligns with Daniel Kahneman’s concept of substitution. When people are asked a complex question, like, “How common is diabetes?”, they unconsciously replace it with a simpler one: “How many stories about diabetes do I remember seeing?” The ease of retrieval just reinforces those false perceptions. And, the media totally exploits this by overemphasizing those rare but impactful events. Drew: Okay, so sensationalism in the media leads us to draw the wrong conclusions. Now, let’s throw another wrench into the works: algorithms. Now, algorithms are supposed to be these neutral, data-driven tools. Yet somehow, they’ve got this reputation for being biased and opaque. How does that happen? Josh: Well, because algorithms, for all their efficiencies, are only as good as the data and the assumptions that feed them. They're not inherently biased, but they can definitely amplify existing biases. Take Amazon’s hiring algorithm, for example. It was trained on résumés from a predominantly male tech industry. So, it started penalizing any applicant who even mentioned women's activities, like being involved in a women's chess club. Drew: So, it's like you're feeding garbage into a system and you act surprised when it spits garbage back out. Garbage in, garbage out, right? Josh: Exactly. The “real” issue isn't just the data itself, but the failure to address systemic inequities during the design phase. The algorithm ended up reinforcing hiring biases instead of correcting them, because no one accounted for the fact that the training dataset was inherently skewed. Drew: And Amazon’s “really” just the tip of the iceberg, isn't it? I'm thinking about that D.C. school district fiasco you talked about earlier, firing over 200 teachers based on an algorithm that was evaluating their "effectiveness"? That sounds like trusting a magic eight ball that’s hooked up to a spreadsheet. Josh: It's a perfect illustration of putting way too much faith in technology. The algorithm judged teachers based solely on standardized test scores. It totally ignored stuff like socioeconomic challenges or classroom diversity. So, you end up with flawed conclusions that penalize dedicated teachers rather than actually addressing the underlying problems in the education system. Drew: Which begs the question: Who is holding these algorithms accountable? I feel like we've just blindly handed over the keys to these systems without “really” asking who is driving. And worst of all, where they're driving us. Josh: Accountability is the key. Tim Harford argues for transparency as the essential tool we need to check algorithmic power. For example, the COMPAS algorithm, which is used in the U.S. criminal justice system to predict the likelihood of a criminal re-offending, was found to disproportionately label Black offenders as higher risk than white offenders, even when they had similar histories. That investigation into COMPAS “really” serves as a blueprint for exposing these hidden biases and sparking important conversations about fairness and accountability. Drew: It makes you wonder, though - how many algorithms out there are making life-altering decisions without anyone questioning their inner workings? Whether it's approving loans, hiring employees, or even deciding who gets parole. Without that transparency, we're just crossing our fingers and hoping that the algorithms aren't screwing things up. Josh: Exactly! Transparency basically ensures that algorithms don't operate as black boxes. And beyond transparency, we need to boost media and statistical literacy on an individual level. Educating people to ask critical questions like, "What broader trend is this headline obscuring?", or "Whose data is this algorithm processing?" can “really” help protect them from some of the common pitfalls. Drew: I think that's the “real” takeaway here. Whether it's the evening news or the latest AI-driven gadget, it's “really” up to all of us to question what we're being told. Question the source, challenge the methods, and, you know, pull back the curtain on those flashy numbers.
Statistical Literacy and Accountability
Part 5
Josh: Recognizing these systemic issues really highlights the need for statistical literacy and accountability. Because, honestly, if we don't understand how numbers shape our world, we're just leaving ourselves vulnerable to manipulation, misinformation, and inequity. And that leads us to today's core topic – statistical literacy and accountability – which is really a call to action. It's about how informed engagement can transform critique into empowerment. Drew: I couldn't agree more, Josh. This really feels like where everything we’ve discussed so far comes together. We’ve talked about the biases that cloud our judgment, the ways data can be manipulated in the media, even the hidden motives behind algorithms. But now it's about addressing these issues head-on, making sure that we, as individuals and as a society, know how to use data responsibly. Josh: Exactly! Because statistical literacy is more than just understanding numbers, it's about understanding their context, and demanding transparency, and being able to critically evaluate what's in front of you. Let's dig into that with two key examples from today's text: Greece's fiscal crisis and systemic gender biases in research. Drew: Ah, Greece. Where bad statistics and even worse accountability almost took down an entire economy. Honestly, that story still baffles me. Josh: Me too. So, to set the stage: back in 2010, Greece was under fire for decades of fiscal mismanagement. The government’s official deficit figures weren’t just wrong; they were outright false, drastically understating how bad the situation actually was. Then came Andreas Georgiou, who took over Greece’s statistical agency, ELSTAT, and he was tasked with cleaning up the mess. Drew: And by "cleaning up the mess," you mean, exposing the real numbers, which, let's be real, isn't exactly a recipe for popularity in the political world. Josh: Exactly. When Georgiou recalculated Greece’s 2009 deficit, the official figure of 3.7% of GDP shot up to 15.4%! We're not talking about a rounding error here; this was the difference between maintaining a shred of economic credibility and triggering an international financial crisis. And while his findings were validated by Eurostat, the EU’s statistical agency, they were politically catastrophic at home. Drew: Let me guess – the politicians didn't exactly throw him a parade for telling the truth, did they? Josh: Far from it. Georgiou was accused of inflating the deficit – essentially treason for making Greece's fiscal situation look even worse. The charges led to years of relentless persecution, including multiple court trials. And this was despite the fact that his work was validated internationally and fundamentally necessary for Greece to recover and qualify for bailouts. Drew: The irony is almost unbearable. This guy does his job with integrity, correcting data that politicians had doctored for years, only to be dragged through the mud for it. It's like punishing the firefighter for reporting the blaze. Josh: That's exactly what it was. And this perfectly highlights the stakes of statistical accountability. Numbers don't just describe the world and what's happening; they actually drive decisions. When those numbers are manipulated or ignored, you end up with distorted public policies, eroded institutional trust, and sometimes, financial collapse. Drew: Not to mention the personal cost. It sends a terrible message to any statistician or academic thinking about speaking out against bad data in the future. Josh: Totally. Georgiou's story really shows how precarious statistical integrity can be when it clashes with entrenched interests. And speaking of entrenched systems that distort data, let's shift gears to gender bias in research, which, okay, it might not trigger an immediate financial crisis, but it definitely carries profound social consequences. Drew: Ah, here we go – “Invisible Women”. What a revelatory look at just how male-centric our data frameworks still are. Josh: Absolutely. Caroline Criado Perez's book shines a spotlight on how women’s contributions and needs have been systematically excluded from data collection, and the real-world consequences of that gap. Take the example of crash-test dummies, for instance. Until recently, they were modeled almost exclusively after male physiology. Drew: Right, because, you know, for some reason, safety engineers decided women don't drive? Josh: Apparently! These male-centric crash tests have resulted in car designs that are less safe for women. Studies show that women are 47% more likely to be seriously injured in car accidents than men, purely because vehicle safety hadn't accounted for differences in body structure. Drew: Wow. So, a so-called neutral policy – designing for the "average driver" – turns out to mean designing for men and just kind of shrugging off half the population. Josh: Precisely. And this oversight repeats itself across countless sectors, from healthcare to urban planning. Another example Criado Perez brings up is drug trials. Medications often have different effects on men and women, but because male subjects have historically dominated these studies, critical insights into women’s health are still lagging behind. Drew: Sounds like the thalidomide disaster is the textbook case here—literally. Not testing that drug thoroughly on women led to catastrophic results. Josh: Exactly. And what’s so troubling is that these exclusions aren't always malicious. Sometimes it's inertia or unconscious bias, but the end result is the same – inequity perpetuated by data blind spots. Drew: It's like building a house with missing blueprints. You can get by for a while, but, eventually, the cracks are going to show. Josh: Couldn't have put it better myself. And this brings us to the solutions, right? Because as bleak as all this sounds, we can address these biases. One big step is simply broadening how we collect and define data. Drew: I’m guessing Uganda’s labor survey reforms are where you’re going with this? Josh: Exactly. By asking the right questions and including informal or secondary work in their labor statistics, Uganda didn’t just fix a numerical oversight – they uncovered the massive economic contributions of women that had been completely invisible before. Drew: Which must've been a game changer, right? Suddenly, you have 700,000 women reclassified as economically active. That’s not just data; that’s humanity being recognized. Josh: Exactly. And it's a powerful reminder that "neutral" data isn’t neutral if it excludes entire groups. If we let biases dictate our methods or ignore what's missing, we're actively perpetuating inequality. Drew: And it's not just about better surveys, is it? Solutions like transparency in methodology – making it clear how data is collected and what might be getting left out – are huge when it comes to accountability. Josh: Absolutely. Fixing these systemic flaws means going beyond the numbers themselves. It's about boosting statistical literacy, encouraging transparency, and holding both institutions and individuals accountable. Drew: Whether it’s Georgiou’s fight for the truth or Criado Perez’s push for inclusivity, the message is clear: if we want a fairer, more equitable society, it’s on us to demand better data – and to understand how it shapes the world we live in.
Conclusion
Part 6
Josh: Okay, let's recap what we've covered today. We started by looking at the psychology of data, right? How emotions and our own biases can “really” skew how we understand numbers. Then we dug into Tim Harford's ten rules for making sense of data, like questioning our gut reactions, digging into the background, and figuring out who or what might be missing from the picture. Finally, we talked about the bigger picture – how the media loves to sensationalize things, and how biased algorithms can make these problems even worse. But also how important it is to be transparent and hold people accountable. Drew: Exactly, Josh. And, you know, if there's one thing that “really” stands out from our conversation today, it's that data is so much more than just numbers. Our own biases influence it, the media often distorts it, and, these algorithms? They're baking it into decisions that impact real people's lives every single day. But what Harford points out, and I think what we've “really” highlighted today, is that if we have the right tools and the right mindset, we can actually see through the haze. Whether that's asking better questions or holding institutions responsible, we don't have to just passively accept statistics as fact. Josh: Absolutely, Drew. Harford “really” drives home the point that being statistically literate isn't just about crunching numbers. It's about understanding the stories they're telling, uncovering the hidden biases, and “really” understanding the power that they hold. When we approach data with genuine curiosity, a good dose of skepticism, and a willingness to dig a little deeper, we're not just understanding the world more accurately, but also helping shape it into something that's more honest and fair for everyone. Drew: So, here’s what we want you, our listeners, to do. Next time you come across a headline, a statistic, or even hear about some new algorithm that promises to tell you the absolute truth, just pause for a moment. Ask yourself: What's the full story here? Who might be missing from this picture? And how am I feeling about this data? Because in a world that's drowning in half-truths and biases, the best thing you can be is an informed, curious, data detective. Josh: Couldn't have said it better myself, Drew. Let’s all keep questioning things, challenging the assumptions that are thrown our way, and remembering that data is “really” just a tool. It's up to us to use it responsibly. Thanks so much for joining us for this deep dive into The Data Detective. Until next time, keep thinking critically, keep asking those tough questions, and, most importantly, stay curious about the world around you. Drew: And remember folks, numbers themselves might not lie, but sometimes, the people who are interpreting them sure do. Catch you next time!
