When True Numbers Lie
13 minStripping the Dread from the Data
Golden Hook & Introduction
SECTION
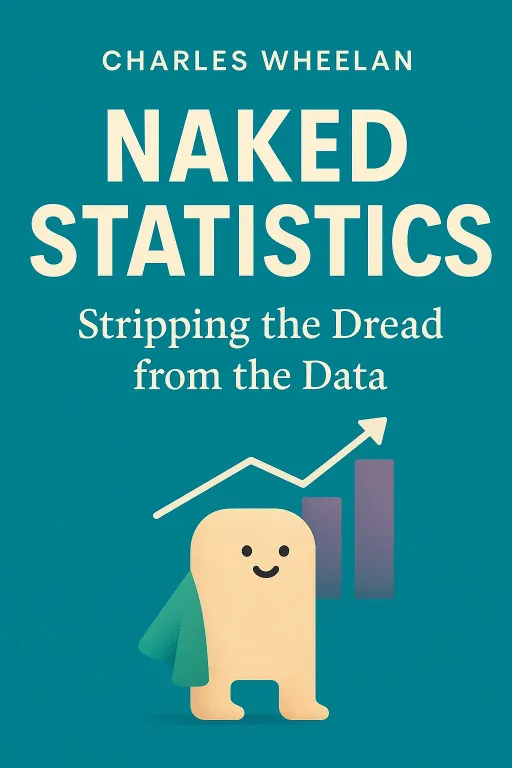
Christopher: Alright Lucas, before we start, what's the first word that comes to mind when you hear 'statistics'? Lucas: Pain. Specifically, the pain of a mandatory college course I tried to forget. Why are we doing this to ourselves, and to our listeners? Christopher: Because we’re diving into Charles Wheelan's Naked Statistics: Stripping the Dread from the Data. And what's fascinating is that Wheelan, who has a Ph.D. in public policy, felt the exact same way. He wrote this book because he hated the abstract pointlessness of his high school calculus class but fell in love with statistics because it's all about solving real-world puzzles. Lucas: Okay, a stats book for people who hate math. I'm listening. Where do we start with this... statistical redemption tour? Christopher: We start with a warning that Wheelan borrows from the mathematician Andrejs Dunkels: "It’s easy to lie with statistics, but it’s hard to tell the truth without them." Lucas: That sounds like a paradox. How can something be a tool for both truth and lies at the same time? Christopher: That's the tightrope we're walking today. The book's first big idea is that you can be profoundly deceptive with numbers without ever telling a technical lie. It's all about the art of the misleading, but factually correct, statement.
The Deceptive Simplicity: How 'True' Numbers Lie
SECTION
Lucas: What do you mean, a misleading but true statement? Like telling someone they have a "great personality"? Christopher: Exactly! That's the book's central analogy. When you say that, you're not lying. They might have a wonderful personality. But you're strategically omitting other, perhaps more relevant, information. Statistics can do the same thing. They simplify the world, and that simplification is where the mischief begins. Lucas: Okay, I need a concrete example of this. How does a number that's technically correct end up fooling us? Christopher: Wheelan gives a classic, brilliant one. Picture this: ten regular guys are sitting in a bar in Seattle, each earning $35,000 a year. What's their average income? Lucas: Easy. $35,000. Christopher: Right. Now, Bill Gates walks in with his talking parrot. His annual income is, let's say, a billion dollars. He sits down. Now there are eleven people in the bar. What is the average income of the patrons? Lucas: Oh, wow. It's going to be… astronomical. Something like 91 million dollars. Christopher: Exactly. The mean income is now $91 million. A news headline could scream, "Average Patron in Seattle Bar is a Multimillionaire!" And it would be factually correct. But is it true, in any meaningful sense? Lucas: Not at all. Ten of those guys are still making $35,000. The "average" is a total distortion of reality. Christopher: And that's the difference between the mean and the median. The median income—the value for the person in the exact middle—is still $35,000. The mean got dragged up by one massive outlier. Lucas: That's a fun thought experiment, but do people actually use this trick to mislead us in the real world? Christopher: All the time. This isn't just a hypothetical. Wheelan points to the debate over the Bush tax cuts in the early 2000s. The administration claimed that 92 million Americans would get an average tax cut of over $1,000. And that was technically true. Lucas: Let me guess. Bill Gates was getting a tax cut. Christopher: Precisely. A small number of extremely wealthy households received massive tax cuts, which pulled the mean way up. The New York Times calculated the median tax cut—the one the typical family in the middle would get. It was less than $100. Lucas: That is infuriating. It’s the exact same data, just presented in two completely different ways to tell two completely different stories. One sounds like a huge boost for everyone, the other sounds like a pittance for most. Christopher: And neither is a lie! That's the genius and the danger of it. It’s why Wheelan argues that statistical literacy is a form of self-defense. You have to ask: which descriptive statistic are they using, and why? Are they showing you the mean or the median? Are they comparing nominal box office numbers for movies from the 1930s and today, without adjusting for inflation? They're all ways of using "true" numbers to paint a false picture. Lucas: It feels like our brains are just not built to catch this stuff automatically. We see a number, we assume it's the truth. Christopher: And if you think that's where our brains fail us, wait until we get to probability. That's where our own minds start actively lying to us.
The Probability Superpower: Why Your Gut Is a Terrible Statistician
SECTION
Lucas: Okay, probability. I remember coin flips and dice rolls. How complicated can it be? Christopher: It can be incredibly counterintuitive. Let's play a game. It's from the old game show 'Let's Make a Deal,' and it’s called the Monty Hall Problem. It’s one of the most famous brain teasers in statistics. Lucas: I'm ready. Hit me. Christopher: There are three doors. Behind one is a brand new car. Behind the other two are goats. You pick a door, let's say Door Number 1. You want the car, right? Lucas: Obviously. No offense to goats. Christopher: Now, the host, Monty Hall, who knows where the car is, does something interesting. He opens one of the doors you didn't pick, say Door Number 3, and reveals a goat. Now there are two closed doors left: your original choice, Door Number 1, and the other one, Door Number 2. Monty gives you a choice: do you want to stick with Door Number 1, or do you want to switch to Door Number 2? Lucas: Hold on. There are two doors left. One has a car, one has a goat. It's a 50/50 shot. It doesn't matter if I switch. Christopher: That is what nearly everyone says. It’s what professors at MIT have said. And it is completely, demonstrably wrong. Lucas: Come on. How? There are two doors. It has to be 50/50. My brain is screaming that it's 50/50. Christopher: This is why our gut is a terrible statistician. You should always switch. Switching doors doubles your chance of winning the car, from 1/3 to 2/3. Lucas: That makes absolutely no sense. Explain. Christopher: Okay, think about it this way. When you first picked Door Number 1, what was the probability the car was behind it? Lucas: One in three. Christopher: And what was the probability the car was behind one of the other two doors combined? Lucas: Two in three. Christopher: Right. Now, Monty opens one of those other doors and shows you a goat. He has not changed the initial probabilities. Your door still has a 1/3 chance. But Monty, by using his knowledge to eliminate a wrong choice from the other two doors, has essentially concentrated that entire 2/3 probability onto the one remaining door he didn't open. By switching, you are betting on that initial 2/3 probability, not on a new 50/50 coin flip. Lucas: Whoa. Okay. My head hurts a little, but I think I see it. He gave me new information by showing me where the car isn't. That's a great party trick, but does this kind of flawed intuition show up in the real world where it actually matters? Christopher: It shows up in the most catastrophic ways. Wheelan connects this kind of probability blindness to the 2008 financial crisis. Before the crash, Wall Street firms relied on a model called "Value at Risk," or VaR. It was supposed to tell them the maximum amount of money a bank could lose on any given day, with 99% probability. Lucas: So it was like a safety gauge. "We're 99% sure we won't lose more than X million dollars today." Christopher: Exactly. It gave them a false sense of security. But as one hedge fund manager put it, it was like "an airbag that works all the time, except when you have a car accident." The model was based on past market data and dramatically underestimated the probability of a "black swan" event—a rare, catastrophic crash. They made the same mistake as in the Monty Hall problem: they misjudged the probability of the unlikely but devastating outcome. They focused on the 99% and ignored the apocalyptic 1%. Lucas: So they were driving a car 100 miles an hour because the airbag had worked perfectly for the last 100 days, not realizing they were headed for a cliff. Christopher: That's a perfect analogy. And it gets even darker. This same misunderstanding of probability led to people being wrongly sent to prison. In the UK, a pediatrician testified that the chance of two children in the same affluent family dying of Sudden Infant Death Syndrome (SIDS) was 1 in 73 million. He got that number by squaring the probability of a single SIDS death. Lucas: But that assumes the two deaths are completely independent events, right? Like two separate coin flips. Christopher: Exactly. But what if there's a genetic predisposition or an unknown environmental factor? Then they aren't independent at all. His flawed probability calculation led to mothers being convicted of murder based on a statistic that was, frankly, garbage. It shows the immense human cost of getting this wrong. Lucas: Okay, so stats can be used to lie, and our brains are naturally bad at it. This is feeling a bit bleak. How do we use this stuff for good? How do we find real, reliable answers in a world this messy? Christopher: That's where we get to what Wheelan calls the "miracle elixir" of statistics. It's a tool so powerful it can answer questions that seem impossible to solve.
The Miracle Elixir: Finding Cause and Effect in a Messy World
SECTION
Lucas: A 'miracle elixir'? That's a big claim. What is it? Christopher: It's a technique called regression analysis. In simple terms, it's a statistical tool that allows you to quantify the relationship between one variable and an outcome, while holding all other important factors constant. It helps you isolate what truly matters. Lucas: So it's a way to untangle a messy knot of correlations to find the actual cause? Christopher: Precisely. And it lets us tackle some of life's biggest questions. For example, Wheelan poses a classic one from the book's final chapters: Does going to Harvard actually make you more successful in life? Lucas: I mean, it seems obvious. Graduates from elite universities tend to earn a lot more money. So, yes? Christopher: But that's just a correlation. Are they successful because they went to Harvard, or did Harvard just pick people who were already destined to be successful? They're smart, ambitious, well-connected... maybe they would have been successful no matter where they went. That's a classic problem of selection bias. How could you possibly separate the effect of the school from the quality of the students it admits? Lucas: Right, you can't just compare Harvard grads to state school grads. It's not a fair fight. So how do you solve it? Christopher: This is the miracle. Two economists, Stacy Dale and Alan Krueger, came up with a brilliant study design. They didn't compare Harvard students to just anyone. They looked at a very specific group of people: students who were accepted to an elite school like Harvard, but chose to go to a less selective university instead. Lucas: Oh, that's clever. So you have two groups of students who were both deemed "Harvard material." One group gets the Harvard "treatment," and the other acts as a perfect control group. They have similar ambition, SAT scores, everything. The only difference is the school on their diploma. Christopher: Exactly. It's a beautiful natural experiment. They created a control group for Harvard. So, they ran the regression analysis, controlling for all those other factors, and looked at their earnings ten years down the line. What do you think they found? Lucas: My gut says the Harvard grads still earned more. The brand, the network... it has to count for something. Christopher: For most students, it made almost no difference at all. The students who got into Harvard but went to Penn State instead ended up earning just as much as the ones who went to Harvard. Lucas: You're kidding me. So the entire mystique is just... selection bias? Christopher: For the most part, yes. The "Harvard effect" was mostly just the effect of admitting brilliant, driven people in the first place. Their success was about who they were, not where they went. Lucas: That is a stunning finding. It completely upends a core belief in our society about elite education. Christopher: It does. But regression also gave us a crucial piece of nuance. There was one group for whom it did make a huge difference: students from low-income or disadvantaged backgrounds. For them, attending the elite school provided a massive boost to their future earnings. The credential and the network really did open doors that would have otherwise been closed. Lucas: Wow. So the miracle elixir doesn't just give you a simple yes or no. It can reveal these incredibly important, subtle truths. It tells you for whom something matters. Christopher: That's its power. It can tell us if a job with low control is more stressful than one with high responsibility—it is, by the way, according to the Whitehall studies. It can help us figure out if smaller class sizes actually improve learning—they do, especially for minority students. It’s a tool for finding the signal in the noise.
Synthesis & Takeaways
SECTION
Lucas: You know, after all this, it feels like this book isn't really about math at all. It's about thinking clearly. It's about developing a healthy skepticism and knowing what question to ask in the first place. Christopher: That's the whole point. Wheelan is arguing that statistics is one of the most powerful tools we have for understanding the world, but the tool is useless without good judgment. You can run a perfect regression on garbage data and get a garbage answer. The principle is "garbage in, garbage out." Lucas: So the most important skill isn't knowing the formulas, but having the wisdom to interpret the results. To see the Bill Gates in the bar, to question the independence of SIDS deaths, to ask if the Harvard grads are successful because of the school or because of who they are. Christopher: Exactly. And Wheelan's core message is that you don't need to be a Ph.D. to do this. The most powerful tool in your statistical toolkit is simply asking, "What's the point? What is this number actually telling me? What is it leaving out?" That one question can protect you from an immense amount of statistical nonsense. Lucas: It’s a kind of intellectual self-defense. I love that. We'd love to hear from our listeners. What's a statistic you've seen recently that made you suspicious? A news headline, a marketing claim, anything. Share it with us on our social channels and let's discuss. Christopher: It's a great way to put what we've learned into practice. This has been a fascinating look at a subject many of us dread, but which turns out to be full of power, intrigue, and even beauty. Christopher: This is Aibrary, signing off.
